

Holt-Winters Exponential Smoothing (Additive & Multiplicative)
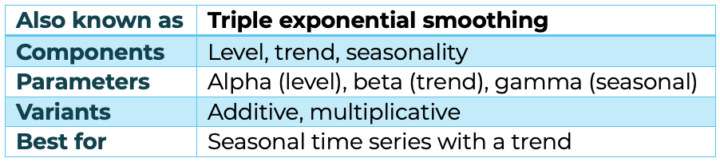
Holt-Winters exponential smoothing is a forecasting technique that layers trend and seasonality on top of a baseline level estimate, producing a seasonal lift factor for each period in the cycle. It’s most useful when the seasonal pattern and the underlying trend are both moving, and moving at different speeds. Three smoothed components drive every forecast: level, trend, and seasonal. Because it’s built from three separate smoothing equations rather than one, it’s also known as triple exponential smoothing.
At a Glance
How Holt-Winters Works
Holt-Winters forecasts by updating three smoothed values every period and combining them into a projection.
The level is a smoothed estimate of where the series would sit with the seasonal and trend effects stripped out — it’s the baseline the other two components adjust. The trend is a smoothed estimate of how much the level is rising or falling per period, similar to what Holt’s linear method tracks on its own. The seasonal component is a set of indices, one per period in the seasonal cycle (twelve for monthly data with an annual cycle, four for quarterly), that capture how far above or below baseline each period typically runs.
Each period, the model recalculates all three: the newest observation updates the level, the change in level updates the trend, and the ratio or difference between the observation and the level updates that period’s seasonal index. The forecast for any future period is then the level plus the trend extrapolated forward, adjusted by the matching seasonal index. Because the seasonal indices are recalculated and carried forward cycle after cycle, they effectively reveal the seasonal profile of the data — which weeks or months consistently run hot or cold relative to the trend line.
Additive vs. Multiplicative Holt-Winters
Use additive Holt-Winters when seasonal swings stay roughly the same size regardless of the trend level; use multiplicative when seasonal swings scale up or down with the level of the series.
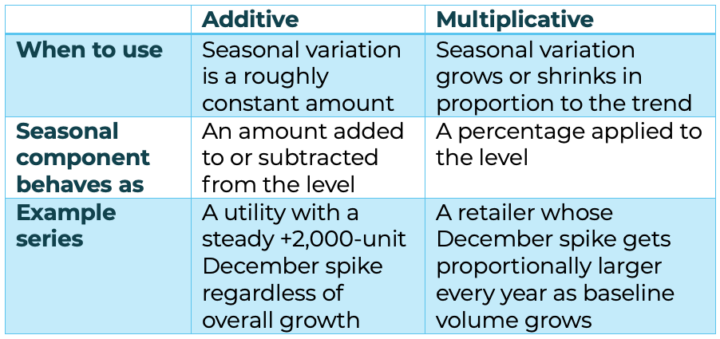
Most modern forecasting software, including Arkieva’s demand planning solution, can test both variants against the historical data and auto-select whichever produces the better fit, so planners don’t have to make the call manually on every item.
Choosing the Smoothing Constants
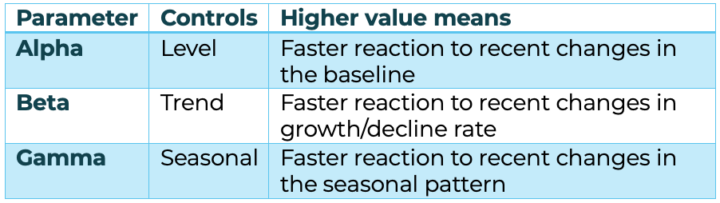
Alpha, beta, and gamma each control how much weight the model puts on the most recent observation versus forecasting history for their respective component — and good forecasting software will optimize all three automatically when they aren’t set manually.
As a general rule, demand histories that shift quickly call for smoothing constants closer to 1, so the model reacts fast to new information. Histories that are stable and consistent call for constants closer to 0, so the model stays anchored to its longer-run average and doesn’t overreact to noise.
How to Run a Holt-Winters Forecast (Step by Step)
- Prepare the time series. Holt-Winters needs at least two full seasonal cycles of history to estimate seasonal indices reliably — for monthly data with annual seasonality, that’s a minimum of 24 periods.
- Choose the seasonal type. Decide additive or multiplicative up front, or let the software test both and select the best fit — the approach Arkieva’s demand planning software uses by default.
- Set or auto-optimize the smoothing constants. Enter alpha, beta, and gamma manually if you have a reason to, or let the software optimize them against the historical error.
- Generate the forecast with confidence limits. The output should include not just a point forecast but a range that reflects the uncertainty in the estimate.
- Review the diagnostics. Check the seasonal indices, the fitted smoothing constants, and the error statistics before trusting the forecast in a planning cycle — this is where a forecaster confirms the model actually fits the demand pattern rather than just producing a number.
Interpreting the Output
The seasonal indices show you exactly which periods run above or below baseline and by how much, making it easy to spot the peaks and valleys in the underlying demand pattern at a glance. The confidence limits around the forecast frame how much risk to build into a plan — a wide interval signals a series that’s harder to pin down and may need a larger safety stock buffer, while a narrow interval supports leaner planning. Error statistics (such as MAPE or MAD, depending on the software) let you compare Holt-Winters against alternative methods on the same series objectively, rather than picking a method by habit.
When To Use Holt-Winters (and When Not To)
Holt-Winters is the right choice for seasonal data with a trend — series where both the direction of growth and the shape of the seasonal cycle matter to the forecast. For a series with no seasonality at all, simple exponential smoothing is a lighter-weight fit. For a series with a trend but no seasonal pattern, Holt’s linear (double exponential smoothing) method covers the trend without the added seasonal machinery. Matching the method to the shape of the data — rather than defaulting to one technique for every item — is one of the more overlooked levers in forecast accuracy.
Frequently Asked Questions
What is the difference between Holt’s method and Holt-Winters?
Holt’s method (double exponential smoothing) forecasts a level and a trend but has no seasonal component. Holt-Winters (triple exponential smoothing) adds a third, seasonal component on top of Holt’s level and trend, making it the appropriate choice when the data has a repeating seasonal pattern.
How much historical data does Holt-Winters need?
At minimum, two complete seasonal cycles — for example, 24 months of history for a series with annual seasonality. More cycles generally produce more stable seasonal index estimates, especially for series with noisy or irregular seasonal patterns.
What are alpha, beta, and gamma in Holt-Winters?
They are the three smoothing constants, each between 0 and 1, that control how quickly the level, trend, and seasonal components respectively adjust to new data. Values closer to 1 make a component more responsive to recent observations; values closer to 0 keep it anchored to historical averages.
Is Holt-Winters better than ARIMA for seasonal forecasting?
Neither method is universally better — Holt-Winters is generally simpler to implement, faster to compute, and easier to interpret, which makes it a strong default for high-volume, automated forecasting across many items. Seasonal ARIMA can outperform it on individual series with more complex autocorrelation structure, at the cost of more tuning per series. Good forecasting software will test multiple methods, including both, and select the best fit per item.

- By Arkieva Software
- September 17th, 2026
- Demand Planning, Supply Chain









FEATURED RESOURCES

RECENT POSTS



Contact us
Please tell us a little bit about yourself to help us better assist you.